New York Giants defense: What’s improved and what hasn’t?
Joe Judge insists the New York Giants have improved over the course of the first seven weeks. Is that statistically accurate?
[sc name=”ryan-honey-banner” ]In one of our previous posts, we pondered over a Joe Judge quote from last week about how the New York Giants have improved over the course of this season, a campaign in which they’re currently 1-6.
If you missed the quote, let’s bring it up again, shall we?
“There’s a lot of progress I see on a daily basis and on a weekly basis,” Judge said, per Jordan Raanan of ESPN. “I know we’re a better team today than we were 10 days ago. I know we’re a better team today than we were in Week 1. I know we’re a better team today than we were in training camp. So is every other team, so we have to keep making progress and developing long term. When you look at the players we’re building within, I see a lot of progress and I see us moving in the right direction.”
We then took a look at a number of offensive statistics, comparing the Giants’ Week 1-4 performances to their Week 5-7 outings in order to properly evaluate whether they’ve actually improved.
And now, to conclude this two-post series, we shall take a look at the defensive statistics, using the same sample sizes from the previous story.
Points Allowed
Weeks 1-4: 24.0 points allowed per game
Weeks 5-7: 26.0 points allowed per game
Season Average: 24.9 points allowed per game
The defense hasn’t exactly improved over the last few weeks despite being relatively strong all year, and it shows within this statistical category. Nonetheless, the loss to the Cowboys may skew the Week 5-7 average, given the fact the Giants allowed 37 points. They only allowed 19 and 22 respectively to Washington and Philly thereafter.
Any struggles existent in and around this category could be due to the defense’s inability to consistently get off the field, which we will talk about soon.
First Downs Allowed
Weeks 1-4: 20.25 allowed per game
Weeks 5-7: 26.33 allowed per game
Season Average: 22.9 allowed per game
There’s no sugar coating it, the Giants have been horrible when it comes to preventing opponents from extending drives in each of the last three matchups. The 26.33 average in Weeks 5-7 includes a whopping 28 first downs allowed against the Cowboys and 27 allowed against the Eagles.
This may be due to the Giants’ usage of the pass rush (or lack thereof). Big Blue must pressure quarterbacks more in the big moments and not let them possess too much time in the pocket.
Rushing Defense
Weeks 1-4: 3.56 yards allowed per carry
Weeks 5-7: 3.9 yards allowed per carry
Season Average: 3.7 yards allowed per carry
This average is deteriorating, but still at a decent mark. The Giants have been successful for the most part when it comes to this category, and there’s no doubt they have a select number of players who’ve been great contributors. Dalvin Tomlinson, Leonard Williams, Dexter Lawrence, and Blake Martinez have all come up big for the Giants thus far on the year.
Passing Defense (Completion Percentage)
Weeks 1-4: 70% completion percentage allowed
Weeks 5-7: 67% completion percentage allowed
Season Average: 69% completion percentage allowed
Despite the fact that this statistic is improving for the Giants, it’s still not at a great mark whatsoever. Allowing 69% of passes to be completed on average isn’t where you want to be as a secondary, especially in a passing league such as the modern-day NFL.
James Bradberry has been great for the Giants thus far, but look at who else is in that secondary: Jabrill Peppers struggles in pass coverage; Ryan Lewis, Corey Ballentine, Madre Harper, and Isaac Yiadom are all inconsistent; Darnay Holmes isn’t fantastic yet either.
The Giants desperately need another reliable body that could complement Bradberry well in the defensive backfield.
Passing Defense (Yards)
Weeks 1-4: 240.5 yards allowed per game
Weeks 5-7: 309.0 yards allowed per game
Season Average: 251.3 yards allowed per game
The Giants are now in the bottom half of the league in this category when they were once at No. 2 in the NFL. Again, it could be due to what we just mentioned for the previous category: the lack of talent in pass coverage.
Looking at this statistic as well as the completion percentage category, it’s clear the Giants desperately need another guy (or guys) to produce alongside Bradberry.
Sacks
Weeks 1-4: 2.5 per game
Weeks 5-7: 2.7 per game
Season Average: 2.6 per game
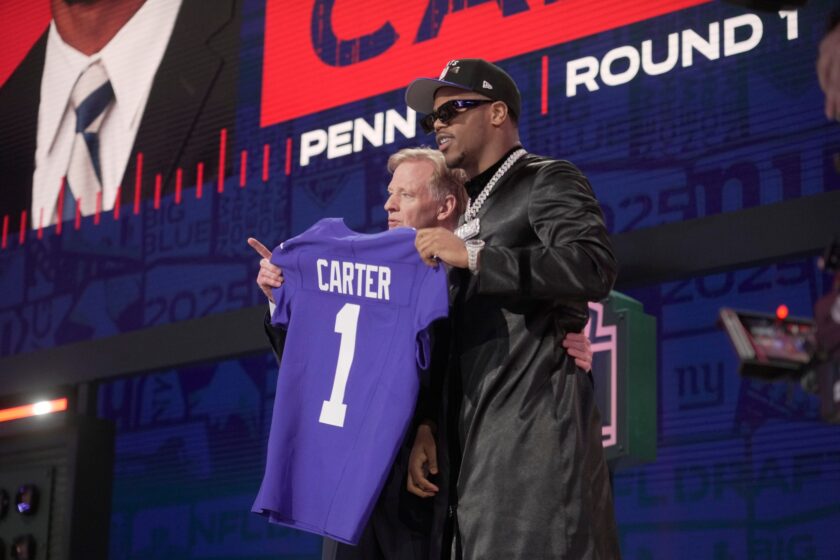
I was surprised to see that this statistic is actually improving even amid the loss of multiple pass rushers. Entering this season, the Giants employed a plethora of edge rushers to utilize, headlined by the likes of Markus Golden, Oshane Ximines, Lorenzo Carter, and Kyler Fackrell. And now, the latter-most individual is the only one on the active roster out of all of them.
Carter is out for the year with an Achilles injury, Ximines is on injured reserve with a shoulder setback, and the Giants traded Golden to Arizona. This stat is okay now, but this Monday night may be the first game where it’s just Fackrell active out of the four aforementioned names, so expect things to potentially be different for the Giants in this department.
Turnovers
Weeks 1-4: 1.0 per game
Weeks 5-7: 1.7 per game
Season Average: 1.3 per game
This number is improving and at a decent mark right now, but could be even better if the Giants pressured the quarterback more. Getting in a quarterback’s face (especially a young and inexperienced one) will cause them to make mistakes.
Time of Possession
Weeks 1-4: 33:10 on average
Weeks 5-7: 31:15 on average
Season Average: 32:20 on average
This time-of-possession mark is improving for the Giants but still not great at all. These averages should be below 30 minutes, and there’s no excuse for them not to be.
This is certainly due to the defense’s inability to show up on third down and in the big moments. If that’s just cleaned up, you can expect Big Blue to improve within this metric.
Third-Down Defense
Weeks 1-4: Allowed 54% third-down efficiency
Weeks 5-7: Allowed 46% third-down efficiency
Season Average: Have allowed 51% third-down efficiency
As was mentioned previously, the Giants can’t seem to make a stop on many third downs, and while the mark has improved (54% through the first four games and 46% through the last three), the season average is still putrid.
This mark should be closer to 33%, not 51%. As I stated before, if the Giants pressured opposing quarterbacks effectively and efficiently on third down, maybe we wouldn’t be having this conversation. But since they don’t, we must complain about it until the issue is ultimately resolved.
Not being able to consistently make a stop on third down proved detrimental for the Giants in the losses to Chicago (9-of-16 third downs converted), San Francisco (8-of-12 converted), and Dallas (5-of-9 converted).
- DRAFTKINGS SPORTSBOOK
BET $5 & GET $150 IN BONUS BETS INSTANTLY!
- FANDUEL SPORTSBOOK
BET $5, GET $150 BONUS!
- CAESARS SPORTSBOOK
$1,000 BET ON CAESARS!
- BETMGM SPORTSBOOK
BET $5, GET $158 BONUS!
- BET365
GET $150 BONUS OR $2,000 FIRST-BET SAFETY NET!


