2017 MLB NL East Power Rankings: The New York Mets and Company
Just days away from 2017 MLB Opening Day, we power rank the division the New York Mets play in, the NL East.
[dropcap]W[/dropcap]ith the 2017 MLB season fast approaching, it’s time to dive into this year’s power rankings. To come to these rankings, I’ve taken multiple aspects into account, including …1. Each of the team’s 2016 statistical performance along with their final record.[sc name=”Mets Center Right” ]
2. An in-depth look at each team’s 2016 injury totals and which teams were most negatively affected by these injuries. Information used was calculated by www.mangameslost.com. Man Games Lost not only keeps track of the total games lost to injury by each team, but also calculates the impact of those injuries through “Lost WAR” (Expected WAR – Actual WAR = Lost WAR). Keep in mind that the rankings in the injury category below are based on a firth = least injured and 15th = most injured ranking.
3. MLB.com conducts yearly player rankings of over 800 players. A 25-man roster is made up of a team’s 15 core players and 10 role players. As a measuring sample, I took the top 20 individually ranked players from each team and measured how each team would rank as a whole.
4. A summary breakdown of each team’s current status, including the expected impact of offseason moves and what to expect from each team in 2017.
1. Washington Nationals
2017 Rankings
#2 National League
#1 Eastern Division
Starting Pitching
ERA – 3.60 (2nd in NL)
WHIP – 1.19 (2nd in NL)
Batting Average against – .235 (2nd in NL)
Relief Pitching
ERA – 3.37 (2nd in NL)
WHIP – 1.19 (2nd in NL)
Batting Average against – .232 (4th in NL)
Offensive Stats
Percentage of runners scored – 40.8% (5th in NL)
Runs Scored – 763 (4th in NL)
Run Differential – +151 (2nd in NL)
Injuries
Total days lost to injury – 498 (1st in NL)
Lost WAR – 3.79 (10th in NL)
MLB 2017 player rankings
Overall team ranking – 5485 (4th in NL)
# of top 100 ranked players – 7
2016 Record – 95–67
2017 Prediction – 97–65
What to expect in 2017:
The Nationals captured the eastern division title for the second time in three seasons last year, but again saw themselves ousted in the first round. Depending on who you ask, you will likely get several very different responses concerning what kind of team the Nationals will be in 2017.[sc name=”MLB Center Right” ]
Some hype over the hefty prospect package they gave up to acquire Adam Eaton, some will praise the Eaton addition, some pick on the Nationals inability to acquire a proven closer, while others look at the solid bullpen they already have. Let’s take away all the hype and hearsay and actually look at the numbers.
The Nationals starting rotation ranked second in ERA, WHIP and BAA, while the pen also ranked in the top four in these categories. Even prior to the Melancon addition at the trade deadline, the Nats ranked among the top in the league with a threesome consisting of Shawn Kelley, Blake Treinen and Sammy Solis, all holding ERA in the low two’s.
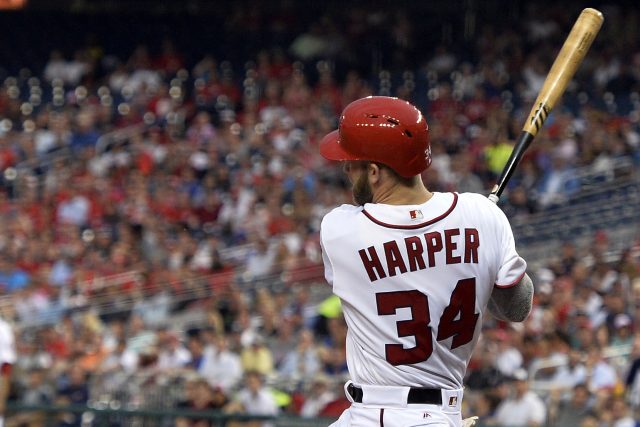
On the offensive side, the Nats were fifth in percentage of runners scored, fourth in runs scored and second in run differential. Even though the Nationals had the fewest days lost to injury, they were the fifth most affected by those injury, totaling a 3.79 lost WAR. Among those injuries was a late season groin injury to Dan Murphy and a shoulder issue that hampered Bryce Harper for most of the season.
With the addition of Adam Eaton, ranked as one of the top three leadoff hitters in the game, coupled with Trea Turner, the Nats have the makings of dangerous top two. Throw them in front of Murphy, Harper and Rendon along with their pitching and the Nats have the makings of a championship caliber team. Not to mention MLB.com’s top 100 consists of seven Nationals, tied with the Red Sox for the most in the majors. If the Cubs falter the Nationals could very well be the team to represent the NL in the World Series.
2. New York Mets
2017 Rankings
#6 National League
#2 Eastern Division
Starting Pitching
ERA – 3.61 (3rd in NL)
WHIP – 1.28 (Tied for 5th in NL)
Batting Average against – .263 (8th in NL)
Relief Pitching
ERA – 3.51 (3rd in NL)
WHIP – 1.26 (6th in NL)
Batting Average against – .238 (6th in NL)
Offensive Stats
Percentage of runners scored – 37.5% (12th in NL)
Runs Scored – 671 (Tied for 11th in NL)
Run Differential – +54 (6th in NL)
Injuries
Total days lost to injury – 886 (7th in NL)
Lost WAR – 3.26 (9th in NL)
MLB 2017 player rankings
Overall team ranking – 5483 (3rd in NL)
# of top 100 ranked players – 4
2016 Record – 87-75
2017 Prediction – 88-74
What to expect in 2017:
Coming off a historic late season run that led them deep into October in 2015, the Mets entered 2016 with a sense of unfinished business. The Mets bolstered what was a weak defensive middle infield with the additions of Neil Walker and Asdrubal Cabrera. Both not only provided a solid upgrade both defensively as well as offensively, but also brought much needed veteran leadership that the team lost after the surprising retirement oft-injured Michael Cuddyer.
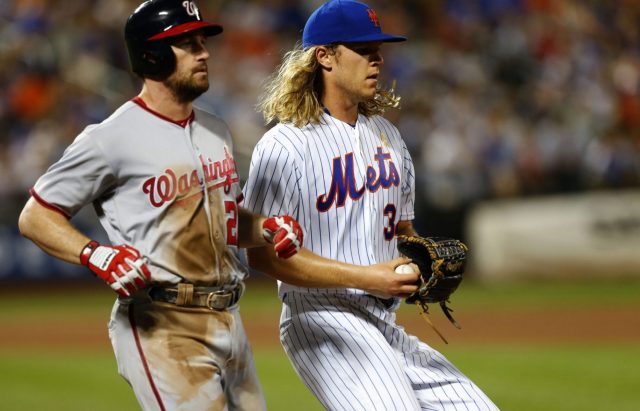
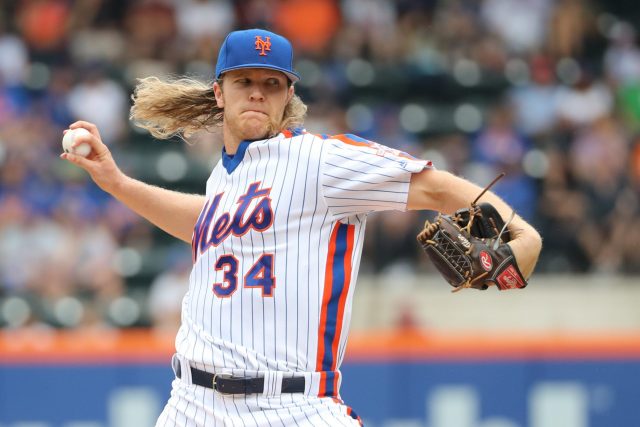
However, even with the offensive boost they provided, the Mets remained a bottom of the league offensive team. While the team did put up its share of high scoring games and showed solid power numbers, the teams clutch numbers and overall performance ranked near the bottom of the league.[sc name=”Noah Syndergaard Player Page” ]
As August progressed, the team began to see a buildup of injuries to a team that was among the healthiest in the league for the first four months. Suddenly in late August, the team came alive and were able to put together a second consecutive late-season run towards the postseason.
Overall, the Mets pitching is what kept them alive, the starting rotation ranked third, fifth and eighth in ERA, WHIP and BAA, respectively, and the pen ranked third, sixth and sixth in these vital categories. But the team finished 12th in the NL in percentage of runs scored, tied for 11th in runs scored and had a run differential of +54, ranking sixth in the NL.
Injuries were not as impactful on the team’s performance as many in the fanbase and organization make it seem. Mets lost a total of 886 days to injury, ranking 7th in the NL (17th overall) and had a total Lost WAR of 3.26, putting them 9th in the NL.
The Mets come into 2017 with a lot of hope, mainly surrounding the outstanding starting rotation and a solid bullpen. However, this team still has some major offensive question marks that could end up costing the team a playoff spot. Two late seasons pushes have been able to overcome very poor offensive performances. If this team is going to secure a third consecutive playoff appearance, they are going to have to perform better offensively.
The Mets cannot fall behind early this season and expect to put together another late-season run. They must get off to a quick start or any chance of a division title could be squashed early on. This team should be in a playoff run until the end but may find themselves just missing a wild card spot.
3. Miami Marlins
2017 Rankings
#9 in National League
#3 in Eastern Division
Starting Pitching
ERA – 4.32 (6th in NL)
WHIP – 1.37 (9th in NL)
Batting Average against – .260 (6th in NL)
Relief Pitching
ERA – 3.63 (8th in NL)
WHIP – 1.35 (Tied for 9th in NL)
Batting Average against – .237 (5th in NL)
Offensive Stats
Percentage of runners scored – 35.9% (Tied for 14th in NL)
Runs Scored – 655 (13th in NL)
Run Differential – -27 (8th in NL)
Injuries
Total days lost to injury – 878 (5th in NL)
Lost WAR – 3.86 (11th in NL)
MLB 2017 player rankings
Overall team ranking – 5988 (8th in NL)
# of top 100 ranked players – 3
2016 Record – 79-82
2017 Prediction – 77-85
What to expect in 2017:
In each of the last three years, many in the industry felt that the young Marlins could take the next step towards wild card contention. But each year they have failed to make those strides.
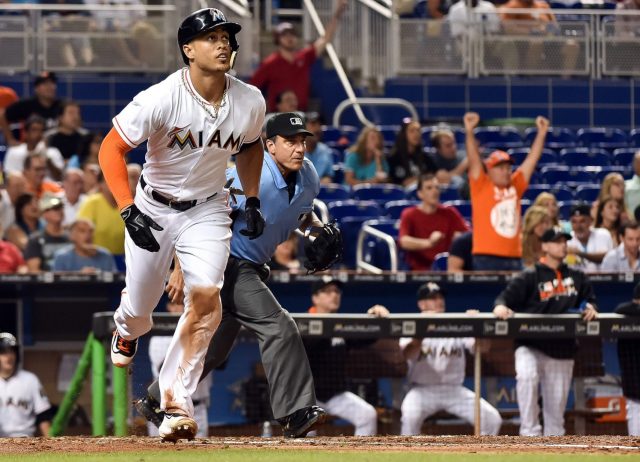
The 2016 season was no different as the Marlins again finished shy of .500. Both offensively and in the pitching department, the Marlins were average to below average finishing the season at 79-82. Their starting rotation finished sixth, ninth and sixth in ERA, WHIP and BAA and eighth, ninth and fifth, respectively, in the pen.
While the Marlins had a very solid team batting average at .263, second in the NL. They had troubles scoring runs, racking up 655 for the season, 13th in the league. Injuries took their toll on the Marlins. Even though they were the fifth healthiest team in terms of lost time, they were the fifth most affected by their injuries with a 3.86 Lost WAR.
Marlins enter 2017 coming off the tragic passing of Jose Fernandez and try to carry on in 2017 in his honor. The organization made a few minor offseason moves in looking to bolster the pitching staff, most notably Edinson Volquez, Jeff Locke, Brad Ziegler and Junichi Tazawa. Unless the Marlins can piece together a respectable pitching staff and the offense can show improvements, this team is looking at another sub .500 season.
4. Atlanta Braves
2017 Rankings
#11 in National League
#4 in Eastern Division
Starting Pitching
ERA – 4.87 (14th in NL)
WHIP – 1.33 (7th in NL)
Batting Average against – .259 (5th in NL)
Relief Pitching
ERA – 3.95 (10th in NL)
WHIP – 1.40 (11th in NL)
Batting Average against – .251 (9th in NL)
Offensive Stats
Percentage of runners scored – 35.9% (Tied for 14th in NL)
Runs Scored – 649 (14th in NL)
Run Differential – -130 (12th in NL)
Injuries
Total days lost to injury – 1479 (14th in NL)
Lost WAR – – 1.13 (5th in NL)
MLB 2017 player rankings
Overall team ranking – 6281 (9th in NL)
# of top 100 ranked players – 2
2016 Record – 68-93
2017 Prediction – 72-90
What to expect in 2017:
The Braves continued through their long-term rebuilding process in 2016, building up a solid farm system while trying to play respectable major league quality baseball. The team got off to a horrendous start going 0-9 to start the season, ending April at 5-18. As the season progressed the Braves showed some progress on the field to the point where they were a respectable team in the second half, going 37-35 post All-Star break.
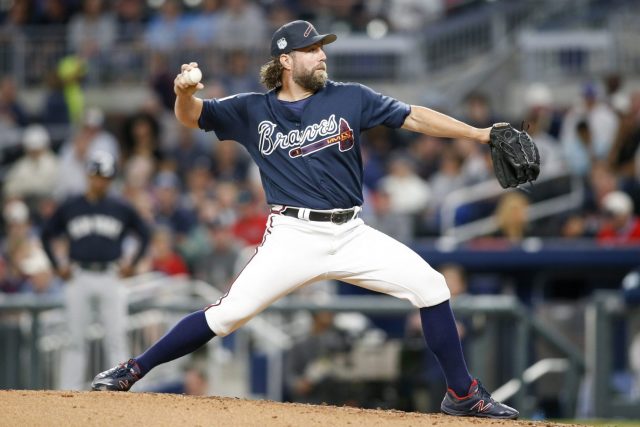
Overall, the Braves offense was their major issue, as they ranked second to last in the NL in percentage of runs scored and runs scored and fourth to last in run differential. Atlanta’s pitching ranked 9th through 14th in all major pitching categories. Injuries took their toll as they racked up 1,479 total days lost, the 2nd highest total days lost to injuries in the National League and third most in the majors, however, in term of injuries affecting the team the Braves were the fifth least effect in Lost WAR in the NL.
Braves completed a very active offseason making over 20 transactions, including the additions of Bartolo Colon, RA Dickey, Kurt Suzuki and Atlanta native Brandon Phillips. Braves also signed Sean Rodríguez, who was involved in an auto accident and will be lost for the season.
The Braves will enter their first season at the shiny new SunTrust Park, still two to three years away from contending, but they should not be taken lightly. They have put together a formidable lineup that can do some damage, as they proved throughout the second half of 2016. The pitching staff should get a slight boost with the additions of Colon and Dickey until to their almost certain deadline deals.
5. Philadelphia Phillies
2017 Rankings
#12 in National League
#5 in Eastern Division
Starting Pitching
ERA – 4.41 (9th in NL)
WHIP – 1.28 (Tied for 5th in NL)
Batting Average against – .262 (7th in NL)
Relief Pitching
ERA – 5.05 (13th in NL)
WHIP – 1.47 (Tied for 12th in NL)
Batting Average against – .271 (14th in NL)
Offensive Stats
Percentage of runners scored – 36.9% (13th in NL)
Runs Scored – 610 (15th in NL)
Run Differential – -186 (15th in NL)
Injuries
Total days lost to injury – 990 (8th in NL)
Lost WAR – 1.13 (7th in NL)
MLB 2017 player rankings
Overall team ranking – 6914 (13th in NL)
# of top 100 ranked players – 0
2016 Record – 71-91
2017 Prediction – 69-93
What to expect in 2017:
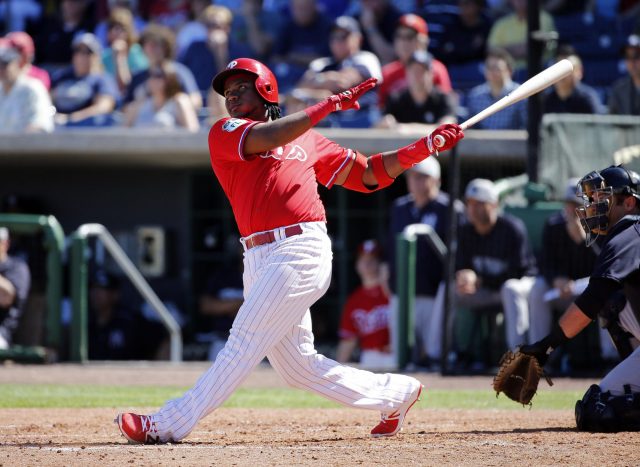
The 2016 Phillies, like their division rival Braves, are in the middle of a long-term rebuilding process. Aside from a terrible June (9-19) and the rough September (10-17), the Phillies played near .500 ball the other four months, as some of their young core began to establish themselves.
Odubel Herrera followed a solid 2015 with an equally impressive 2016 and fellow core brothers Maikel Franco and Cesar Hernandez continued to make strides.
However, when looking at the whole picture, the 2016 season had its share of the expected growing pains. The pen ranked near the bottom of the league (12th to 14th) in each major category and the rotation, although better than the pen, wasn’t great either, ranking near the middle of the league. The offense was a disaster, ranking at or near the bottom across the board, including last in run differential, last in runs scored, third to last in Percentage of runners scored and were awful in all clutch situations.
The Phillies had a semi-active offseason bringing in some established veterans including Joaquin Benoit, Michael Saunders, Pat Neshek, Clay Buchholz and Howie Kendrick to provide leadership to the youngsters and likely will be used as trade bait come deadline time to bring in more young talent. 2017 will be more of the same, more developing, more growing pains and more youth. The Phillies will likely take a stop in the basement of the NL East as the Braves are sure to leapfrog them.
National League East
Washington Nationals 97 – 65
New York Mets 88 – 74
Miami Marlins 77 – 85
Atlanta Braves 72 – 90
Philadelphia Phillies 69 – 93
National League Central
Chicago Cubs 99 – 63
St. Louis Cardinals 90 – 72
Pittsburgh Pirates 81 – 81
Cincinnati Reds 68 – 94
Milwaukee Brewers 66 – 96
National League West
Los Angeles Dodgers 95 – 68
San Francisco Giants 91 – 71
Colorado Rockies 83 – 79
Arizona Diamondbacks 74 – 88
San Diego Padres 64 – 98
National League
1. Chicago Cubs 99 – 63
2. Washington Nationals 97 – 65
3. Los Angeles Dodgers 95 – 68
4. San Francisco Giants 91 – 71
5. St. Louis Cardinals 90 – 72
6. New York Mets 88 – 74
7. Colorado Rockies 83 – 79
8. Pittsburgh Pirates 81 – 81
9. Miami Marlins 77 – 85
10. Arizona Diamondbacks 74 – 88
11. Atlanta Braves 72 – 90
12. Philadelphia Phillies 69 – 93
13. Cincinnati Reds 68 – 94
14. Milwaukee Brewers 66 – 96
15. San Diego Padres 64 – 98
[sc name=”Mets Links” ]
[sc name=”Mets Link Next” link=”https://elitesportsny.com/2017/03/31/new-york-mets-experienced-bats-reward-elite-pitching/” text=”Experienced Bats Have to Reward Elite Pitching” ]

Born in NY and raised in NJ, Mets fan since 1988. Baseball is a huge part of my life. Graduated from Western New England University's school of business in 2004 with a degree in Sports Management, one of the top rated business schools and sport management programs in the county. Has baseball industry experience including marketing with the Red Sox, scoreboard operator, promotions/marketing and mascot for the New Haven County Cutters and hired by a minor league ownership group to conduct a stadium evaluation for a potential buyer, was chief editor of college literature magazine and received an award for being an inspiration to the college community.