

Another disappointing season is in the books for the New York Knicks. These are five statistics that explain what went wrong.
The New York Knicks finished their 2016-17 season with a meaningless win that negatively impacted their standing in the draft lottery. It was a predictable result for a typically unlucky franchise.It’s easy to explain how the season went wrong for the Knicks if you reference their history. Their lack of postseason success is legendary.
The Knicks haven’t won an NBA Finals in over 40 years, and they have fewer playoff wins since 2001 than the Seattle Supersonics. The Sonics haven’t existed since 2008.
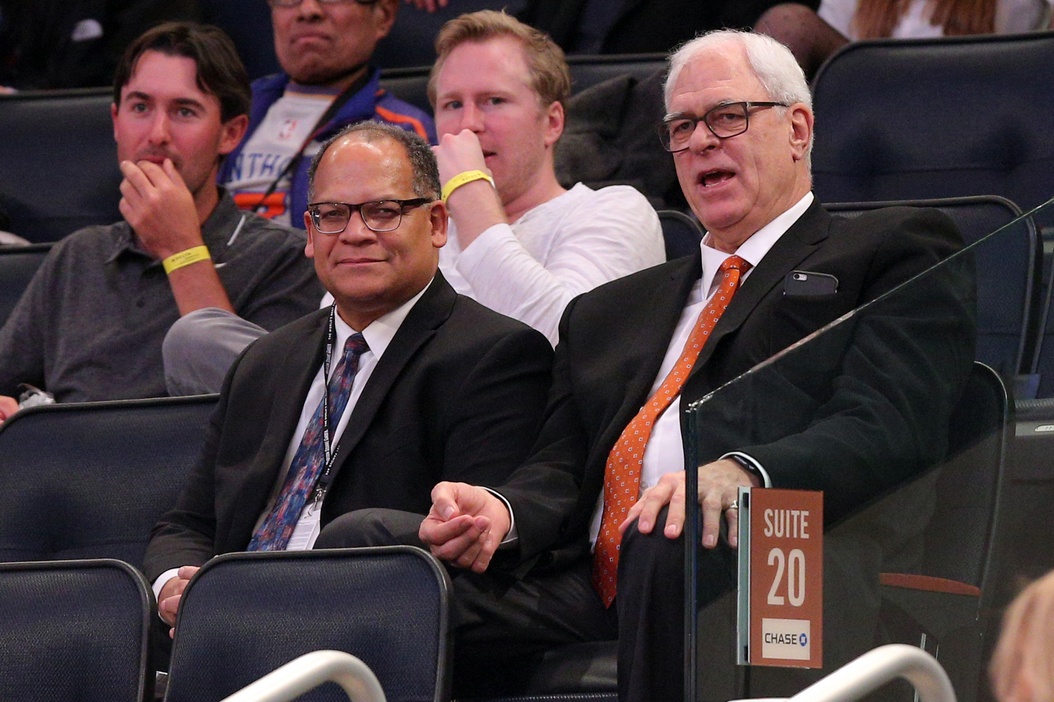
Phil Jackson was supposed to lend some credibility to New York. Instead, he’s made them even more of a league-wide punchline and tarnished his reputation in the process.
With all the emotions that are involved in this failing season, the Jackson-Carmelo Anthony feud and Kristaps Porzingis‘ exit meeting blow off, we decided to take a look at things from a purely analytical perspective.
These are five statistics that explain what went wrong with the Knicks’ 2016-17 seasons.
1. Defensive Rating: 108.7 (25th)
The Knicks panicked when they lost four of their first six games and appointed Kurt Rambis as their defensive coordinator. The day after allowing 65 points in the second half of a loss to the Utah Jazz the Knicks were ranked 30th in defensive rating.
Phil Jackson didn’t wait long to make a power move and get his former assistant a more hands-on role with the team. Head coach Jeff Hornacek didn’t exactly give Rambis a ringing endorsement saying “it could’ve been anyone” who took on the coordinator role.
It didn’t lead to any changes. The Knicks were still one of the worst defensive teams in the league. They allowed 100-plus points in 67 games.
The original starting lineup of Derrick Rose, Courtney Lee, Anthony, Porzingis, and Joakim Noah allowed a whopping 111.6 points per 100 possessions (via NBA.com). They were even worse Willy Hernangomez subbed in for the injured Noah, allowing 115.5 points per 100 possessions.
The struggles of Noah, expected to anchor the defense, were a big part of why the Knicks were so bad on that end of the court.
New York didn’t have a single rotation player with an individual DRtg under 105. The team finished 25th in DRtg. A decline from last season when they were 18th.
2. Defensive Rebound Percentage: 74.1% (30th)
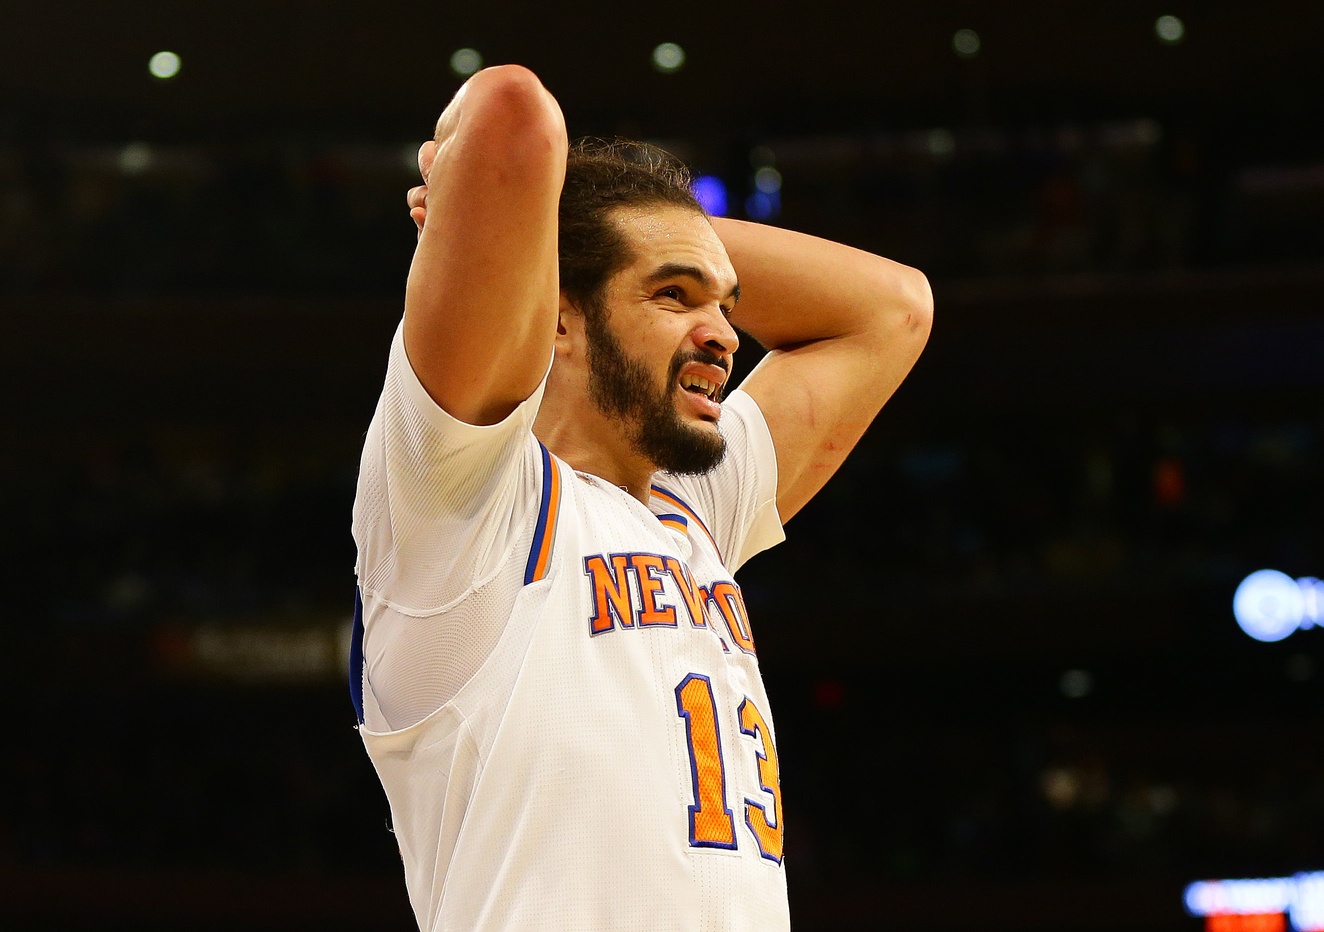
Joakim Noah averaged 9.4 rebounds per game in his nine seasons with the Bulls. Noah was supposed to take Robin Lopez‘s role as the defensive anchor and primary rebounder, but it didn’t work out.
The former Defensive Player of the Year posted his lowest rebounding average (8.7) since ’08-’09 in only 46 games.
His injuries led to him finishing fifth on the squad in total defensive rebounds. The struggles of the veteran big man resulted in New York’s poor ratings on the glass.
Anthony pulled down more defensive rebounds than any other player on the squad, but it was the rookie Hernangomez who finished first in defensive rebound percentage.
The Knicks were pushed around by bigger frontcourt players the entire season. It led to them finishing dead last in opponent second chance points and 24th in opponent points in the paint.
3. Effective Field Goal Percentage: 49.6% (25th)
This perfect metric is known as effective field goal percentage. It adjusts for the fact that 3-point field goals are worth 50 percent more than 2-point field goals.
In today’s NBA eFG% is an excellent indicator as to who the top teams in the Association are. Golden State and Cleveland are one and two in the category.
The 2016-17 season had the highest average eFG% by team in the 71-year history of the NBA. The Knicks need three-point shooters if they want to be a contender.
They had two good three-point shooters (Lance Thomas and Courtney Lee) with the rest of the team hovering around or below the league average from downtown.
Anthony and Porzingis were first and second in three-point attempts, but neither player was efficient. Anthony was 36.0 percent, and Porzingis was 35.7 percent. Hovering right around the league average.
4. Mid-Range Attempts Per Game: 25.3 (1st)
The triangle offense is a beautiful thing. If you think antiques are beautiful.
Phil Jackson’s signature offensive system is geared towards the mid-range game, and away from the three-point line. Hence, Jackson telling reporters in his post season press conference he thought threes were a “cheap way to score.”
According to NBA.com, the Knicks were second in percent of points on mid-range shots. Conversely, they were 24th in percent of points from three-point range and in the paint.
They took a lot of mid-range shots, but Anthony was the mid-range king. The ten-time All-Star showed incredible efficiency from that area.
He was second in total mid-range attempts (via NBA.com) but still converted at a 45 percent clip.
New York was 25th in three-point attempt rate (percentage of shots being from three-point range) and 20th in three-point attempts per game. The best teams take and make threes. There can only be one San Antonio Spurs.
Passes Made Per Game: 324.7 (3rd)
The Knicks have finished in the top three in passes made per game during all three seasons of Phil Jackson’s reign. That triangle offense again.
Unfortunately, it hasn’t led to much success on the assist front. In 2014-15 they were 19th in assists per game, and last season they were 26th.
In 2016-17, they at least made a leap up from the bowels of 26th. All the way back to 19th. That’s where they were in the historically bad season of ’14-’15.
The Knicks were 26th in assist to pass percentage. That’s pretty brutal. When your point guard isn’t exactly the passing type that’s what happens.
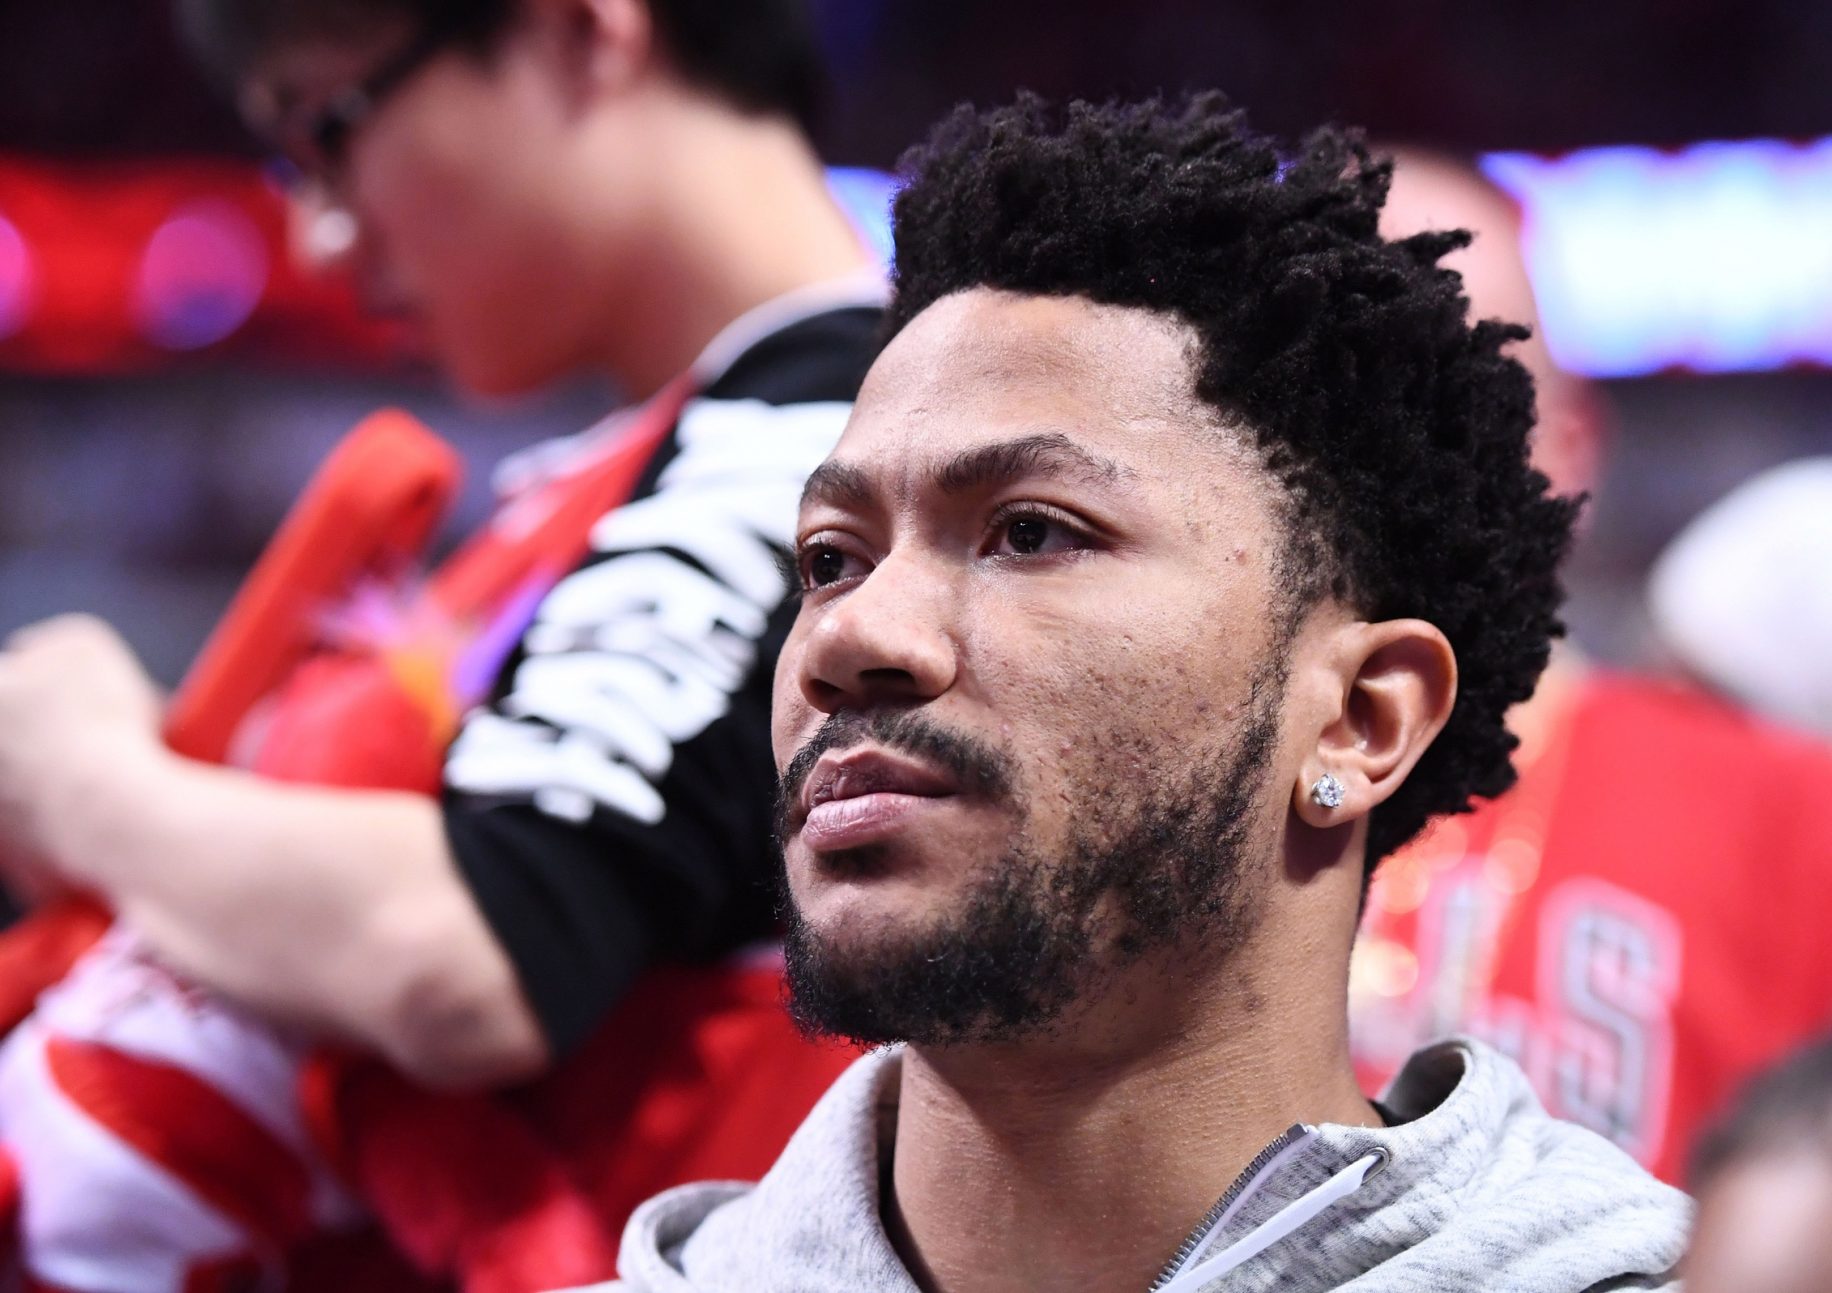
Here’s a fun stat. Remember Brandon Jennings? He was supposed to be Rose’s backup all season and a potential Sixth Man of the Year candidate.
The Knicks cut him in Feb. after 58 games and he went to the Wizards. Jennings still finished with more total assists as a Knick than Rose did.
In 64 games, the former MVP posted just 283. Jennings notched 287. A guy who wasn’t on the roster at the end of the season led the team in assists. That about says it all for the way this season went.


